What are the important numbers in Google Analytics?
Google Analytics can be overwhelming. There are so many different reports, and it isn’t always clear what they mean.
Fortunately, there are only a handful of reports that truly matter to the typical business owner.
Usually, the first place to go is:

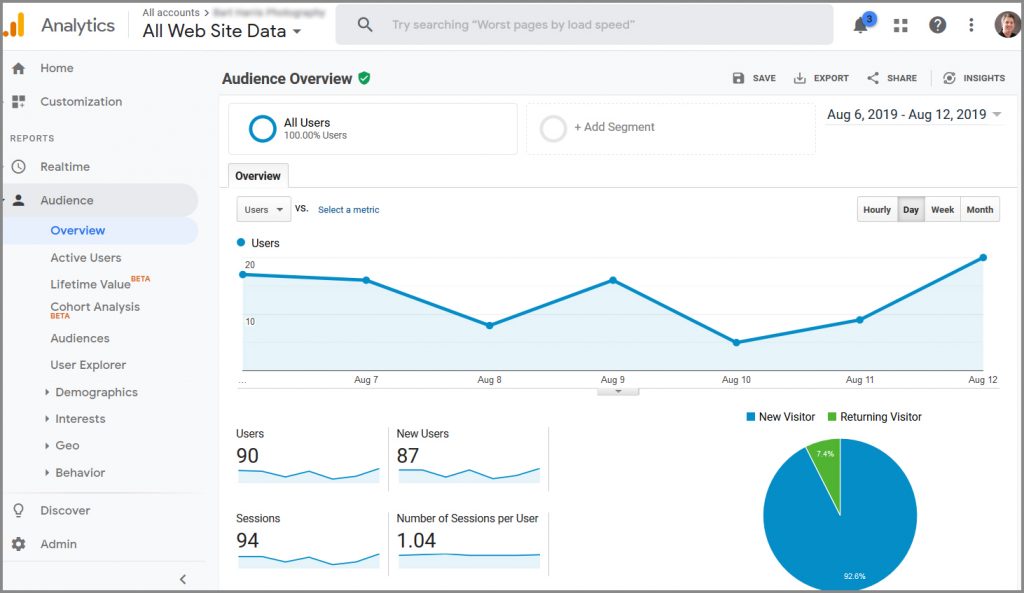
Audience -> Overview
When you open Google Analytics, the first thing that you want to do is select a date range in the upper right corner. The selected dates will follow you throughout the analytic session.
Users – the number of unique individuals (computer IP numbers) who visited your site in a given time period.
Sessions – the total number of times the website was viewed. It is possible for a User to visit more than once. Hence, Sessions are always more than users.

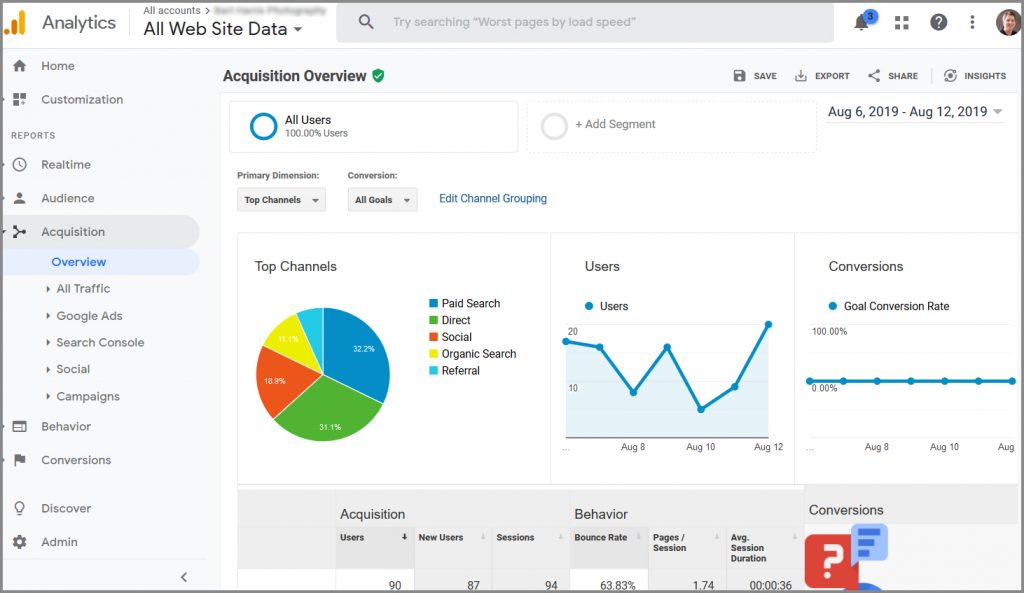
Acquisition -> Overview
This chart shows how your visitors are visiting your site. Some are through Organic Search (e.g. Google), some through Social Media, some are Referrals (i.e. links from other sites).

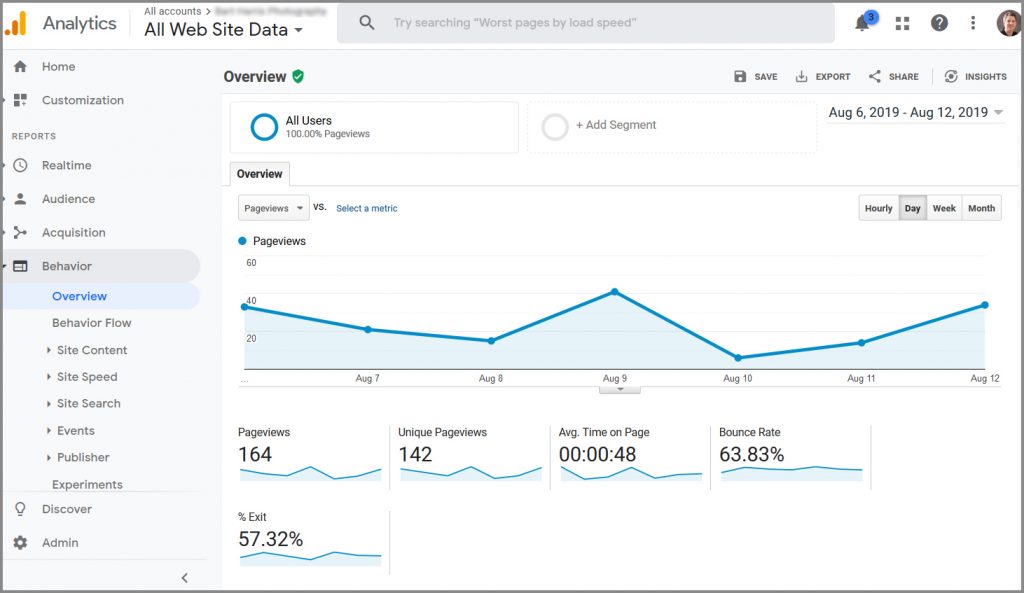
Behavior -> Overview
See which pages on your site are the most popular.
There are many more details available, but these three basic charts will get you started.


 MADE IN THE USA